Nikita Kucherov
RWTampa Bay LightningAge 33
+2.4
WAR per 82 games
2023–24 to 2025–26
Elite
among 392 qualified current NHL forwards
Kucherov ranks near the top of the comparison group for WAR per 82 games. His wins come from a few places: process, finishing, power play and penalties. He is rarely used on the penalty kill.
Where the wins come from
Three-season totals · wins above averageProcess
+3.19
Strength
58 hours on the ice · elite per minute
Finishing
+1.77
Strength
109 goals on 83.1 expected
Power play
+0.58
Strength
982 min · 4.2 per game
Penalty kill
+0.00
Rarely used
4 min · 0.0 per game
Penalties
+0.75
Strength
drew 67, took 43
The long view
The contract
Annual cap hit2026-27 · 1 year left · Through 2026-27 · UFA$9.5M
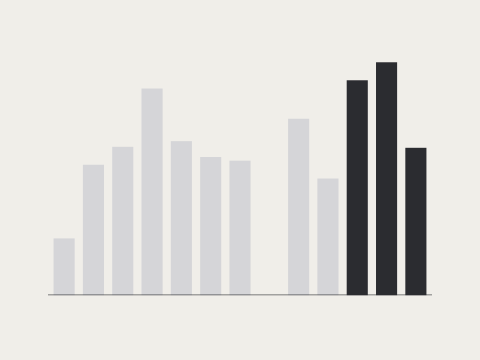
The chart and WAR $ column show each season’s WAR in 2026–27 cap dollars.
Recently on wRink
Season by season
| Season | GP | Process | Finish | PP | PK | Pen | WAR | WAR $ |
|---|---|---|---|---|---|---|---|---|
| 2013–14 | 52 | +0.50 | −0.15 | +0.02 | 0.00 | 0.00 | +0.44 | +$3.6M |
| 2014–15 | 82 | +0.87 | +0.48 | +0.11 | −0.00 | +0.01 | +1.59 | +$13.1M |
| 2015–16 | 77 | +0.91 | +0.39 | +0.11 | −0.00 | +0.15 | +1.70 | +$14.0M |
| 2016–17 | 74 | +1.16 | +0.69 | +0.07 | 0.00 | +0.20 | +2.27 | +$18.8M |
| 2017–18 | 80 | +0.51 | +0.57 | +0.05 | +0.00 | +0.54 | +1.83 | +$15.1M |
| 2018–19 | 82 | +0.52 | +1.06 | +0.08 | +0.00 | −0.06 | +1.68 | +$13.9M |
| 2019–20 | 68 | +0.70 | +0.58 | +0.05 | −0.00 | −0.04 | +1.36 | +$11.2M |
| 2021–22 | 47 | −0.16 | +0.37 | +0.82 | 0.00 | +0.14 | +1.23 | +$10.2M |
| 2022–23 | 82 | +0.51 | −0.20 | +0.33 | +0.00 | +0.57 | +1.42 | +$11.8M |
| 2023–24 | 81 | +1.32 | +0.45 | +0.26 | +0.00 | +0.33 | +2.59 | +$21.4M |
| 2024–25 | 78 | +1.29 | +0.49 | +0.37 | −0.00 | +0.32 | +2.70 | +$22.3M |
| 2025–26 | 76 | +0.57 | +0.83 | −0.04 | +0.00 | +0.10 | +1.66 | +$13.8M |
| Career | 879 | +8.70 | +5.55 | +2.22 | −0.00 | +2.26 | +20.47 | +$169.4M |
Shaded rows are the three-season sample used above.GP counts games with available data. Career totals add the seasons shown.
About these numbers
Component columns measure wins above average. WAR includes one replacement adjustment in the overall total. Ratings compare 392 qualified current NHL forwards; special-teams ratings reflect players deployed in that role.
WAR $ converts measured WAR at $8.3M per win in 2026–27 cap dollars. It describes past contribution, not a salary or forecast.